remote Sensing
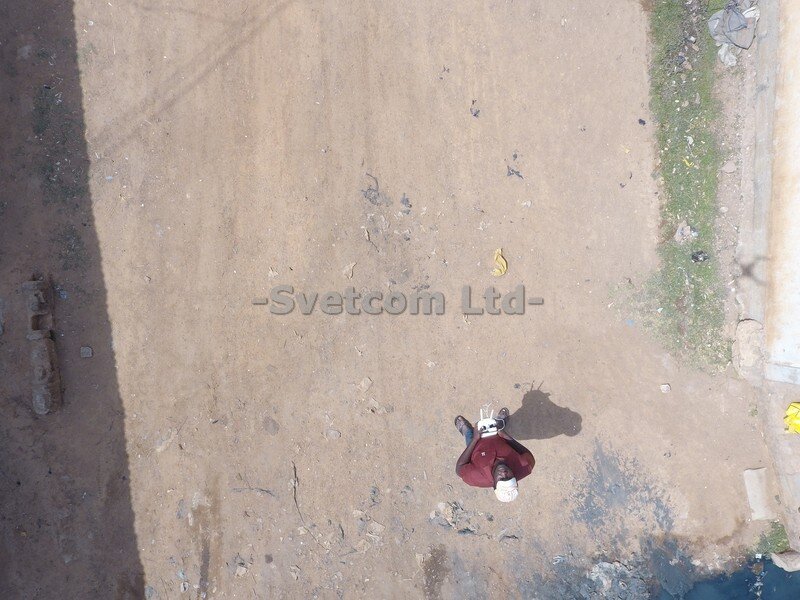
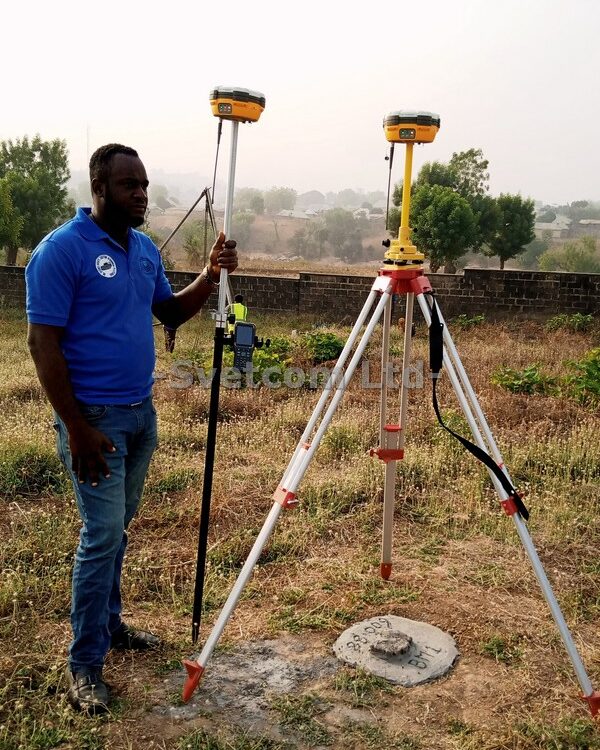
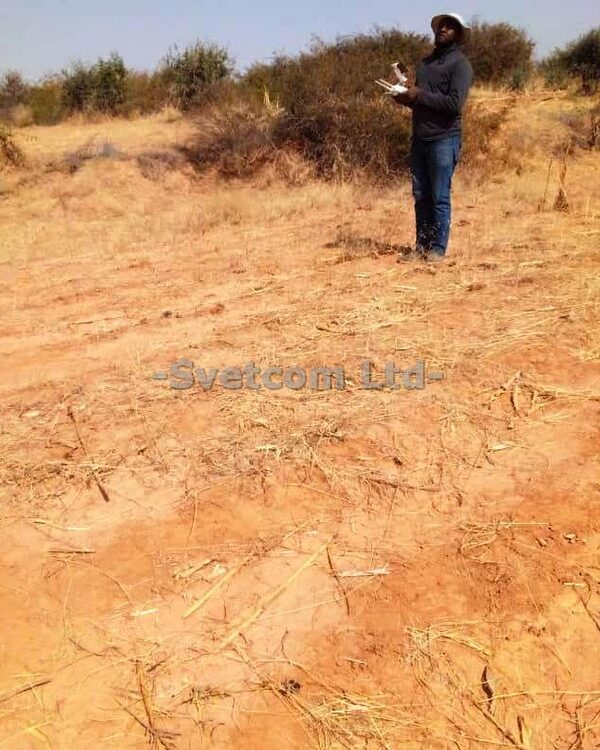
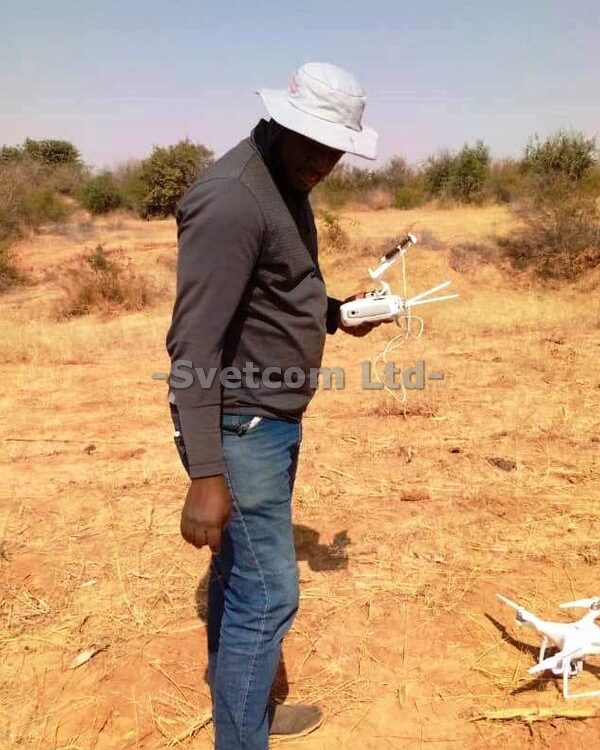
Remote sensing is the process of acquiring information, detecting, analyzing, monitoring the physical characteristics of an area without having any physical contact with the object being studied. It is basically a surveying and data collection technique that can retrieve large amounts of data at a time. due to its mode of deployment, it heavily reduces the manpower required to collect such data. it also makes it quite easy to collect data from geographically difficult terrains which physical access is not possible e.g. gorges, steep hills, cliffs, etc. Following are some major fields that remote sensing can be used for:
- Weather
- Forestry
- Agriculture
- Topographical survey
- Mineral exploration
- Security assessment
- Crop Assessment
- flood inundation mapping
- Hydrological modelling
- Analyzing condition of rural roads
- Creating base maps for visual references
- Controlling forest fires
- Detecting land use patterns
- estimating forest supplies
- Locating construction and building alterations
- Observing effects of climate change
- Wildlife conservation
- Predicting potential landslides
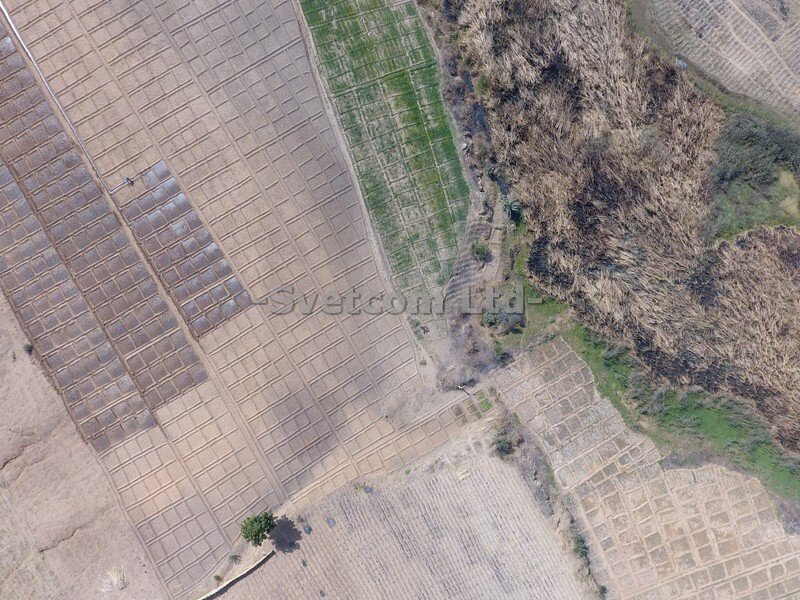
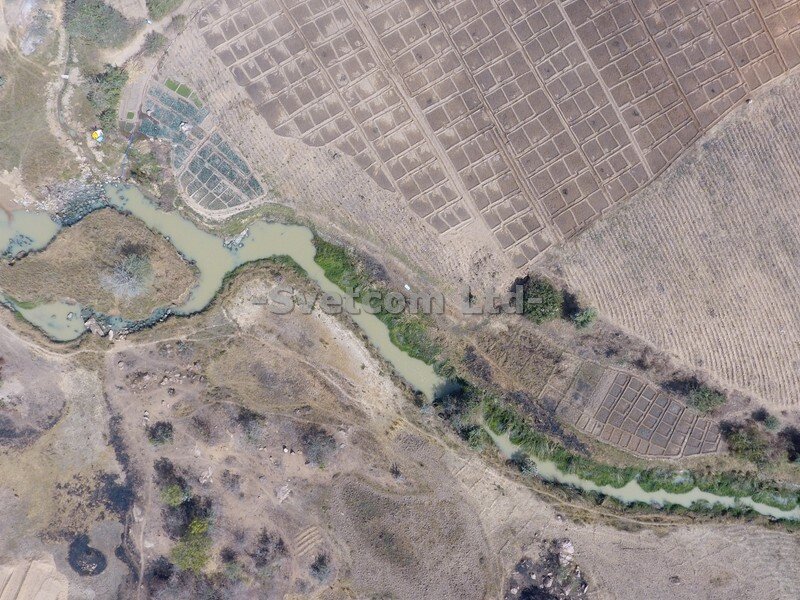
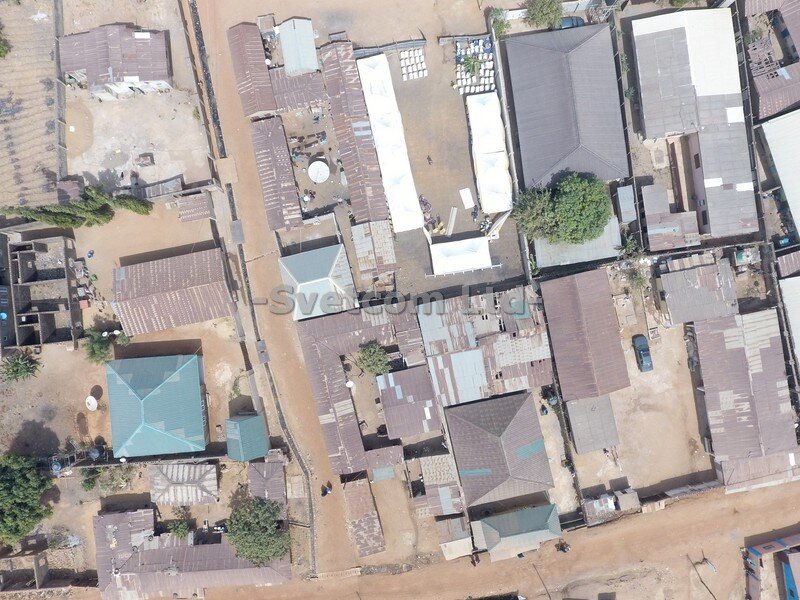
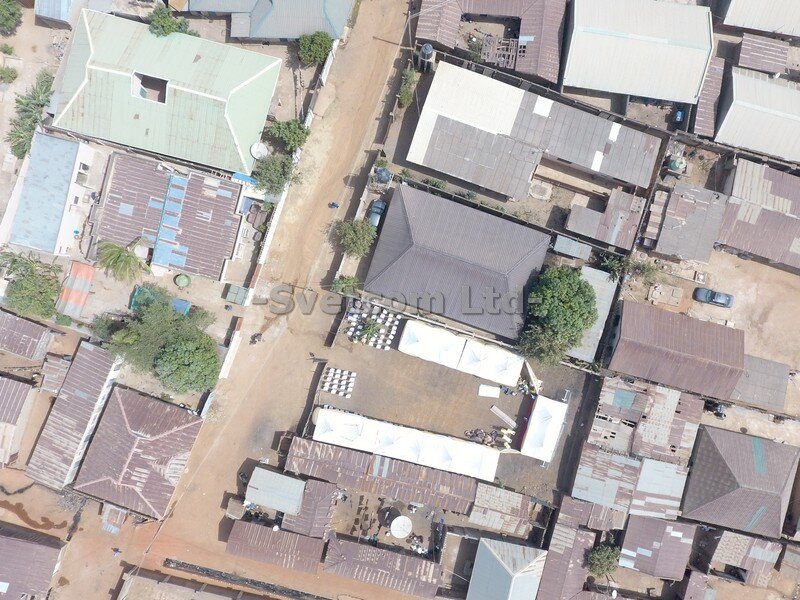
interpretation of data
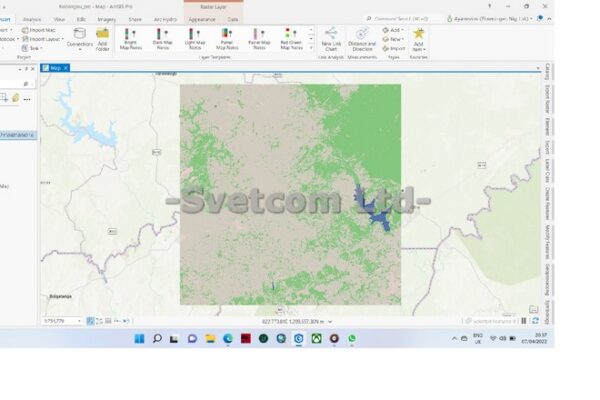
On its own remote sensing cannot analyse or intepret the data it collects. this is why a secondary tool and training is required to analyse and present the data in a form that aids in decision making. A single image captured through remote sensing can be analyzed and interpreted for use in various applications and purposes. There is no limitation on the extent of information that can be gathered from a single remotely sensed image. Very accurate DTM’s or digital terrain models can be achieved through aerial photography and Remote Sensing data. All remotely sensed data have to undergo a certain degree of preprocessing, i.e. data must be calibrated, normalized (e.g. for solar zenith angle and satellite position), atmospherically corrected and geometrically corrected and geocoded.
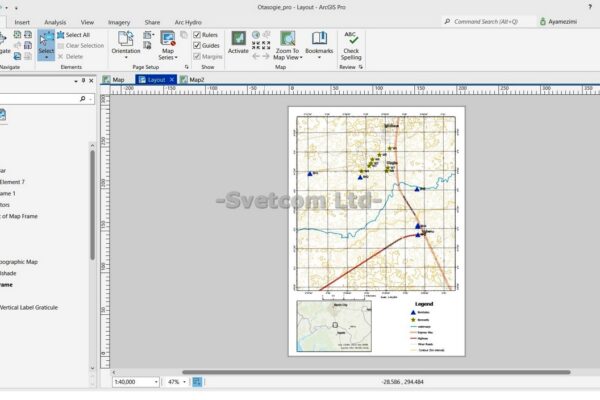
GIS on the other hand is a computer system consisting of hardware and software: A GIS is a system that is designed to collect, store, update, manage, manipulate, analyze and represent graphical and non-graphical spatial data. it can process large amounts of spatial data with geo-located reference points. the software allows storage, processing, and query of the data under review.
data presentation and analysis
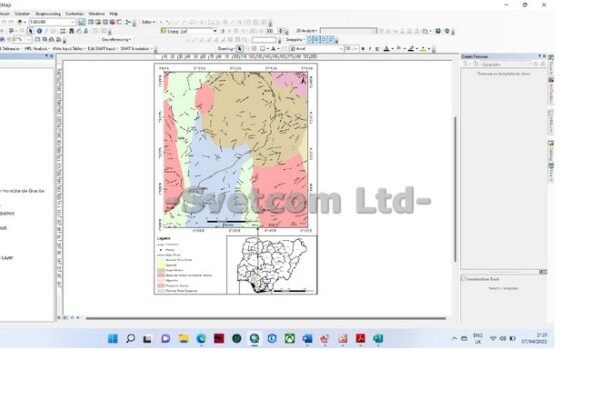
Basically, the data in a GIS can be subdivided into graphical and non-graphical data. Graphical data are digital descriptions of map features containing coordinates, symbols, and rules. Non-graphical data (attributes) describe the characteristics, qualities, or relationships of map features at a specific geographical location – basically extra information about the graphical data itself. The extra data is stored as tables relating to objects displayed on the maps.
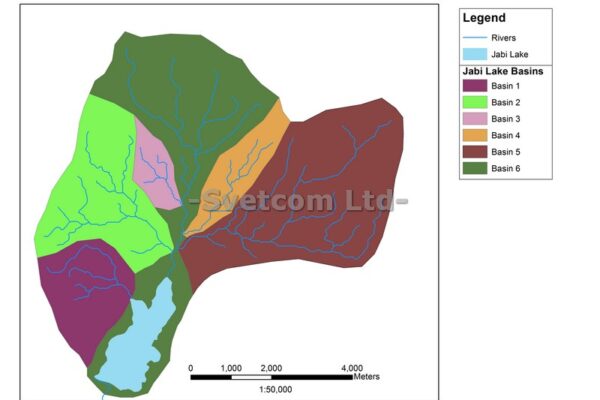
The software permits the correlation and presentation of data in a visual manner, that reveals hidden relationships between data components. it is more user-friendly than the process of actually collecting the data. GIS technology can provide resource managers and decision-makers with tools for effective and efficient storage and manipulation of remotely sensed information and other spatial and non-spatial information. Take, for instance, DEM (digital elevation model) tiles from was acquired through remote sensing. But you use a GIS (such as QGIS or ArcGIS) to analyze it and get results which could be drainage basin delineation, topographic wetness index, etc.
mission
To focus on contributing to the sustainability of the earth’s resources via the use of environmentally friendly solutions from renewable energies as a decisive step towards countering climate change and ensuring a future worth living for our children and future generations.
vision
To develop a reputation in the renewable energy industry as a trusted and reliable partner , fully committed to meeting of our customer’s energy requirements. With sound work ethic and morals to maintain our customer’s long-term trust and support.
values
- Transparency
- Honesty
- Accountablity